What are Software Delivery Cycle Times ?

What are Cycle Times good for ?
Cycle Times are an accurate measure of the speed with which we can deliver software given all of the different variables that can impact delivery. That may sound like the more traditional metric of Velocity but, oddly, Velocity is less a speed and more a measure of the quantity of work a team can deliver in a given cycle - or more typically a sprint.
Example of Cycle Times vs Velocity:
Imagine a team of 4 identical developers each able to output 10 points per sprint or 40 points per team. They also measure cycle time which tells them that it takes 16 days to deliver 85% of their tasks. They measure the delivery time of 85% tasks to eliminate outliers and give them an understanding of how quickly most of their tasks are delivered. Of course, in this theoretical case there will be no outliers.
Another identical developer joins and velocity goes up to 50 points for the team but the cycle time will remain the same because the team has greater capacity but is still delivering at the same speed - so we see that velocity and cycle time are telling us different things.
So what does cycle time tell us ?
Imagine that the team identifies some sort of efficiency that can be made in their pipeline - maybe add a testing engineer, perhaps fix some flaky tests or start to refine tasks asynchronously rather than in big planning meetings where the first few cards are planned well and the rest a bit rushed.
These changes in process would mainfest themselves as changes in cycle times that would indicate how much more - or less - efficient our process has become.
But surely Velocity measures that too ?
“Wait…” I hear you cry. “Surely these changes would also reflect themselves as changes in velocity ?”
And you’d be right. In our perfect example it would but real world velocity is an abstract, aggregate of all work and is often quite a volatile number which makes it difficult to remove those outliers and gain a better understanding of how most of our tasks are delivered.
Cycle Time measures one thing - speed - using a simple measurement - days. Outliers are removed in a way that is intuitive making it much easier to understand what’s actually going on.
Better still, once you start to think cycle times you can measure different parts of your delivery pipeline in comparable ways. You may notice, for example, that cycle times around testing seem disproprtionately large compared to other stages enabling you to focus efforts on making testing more efficient - tell the team they need to spend more time on PRs or explain to the business the now measurable value of getting a testing engineer.
Can I use Cycle Times to predict delivery ?
Surely if you know the size of the team then cycle times can help you predict delivery.
Yes, if you’re doing a good job of managing the WIP - and No. Typically managers want a delivery date - cycle times won’t give you that. Cycle Times are probabalistic:
Lets say we have typical historical data from our last 100 tasks:
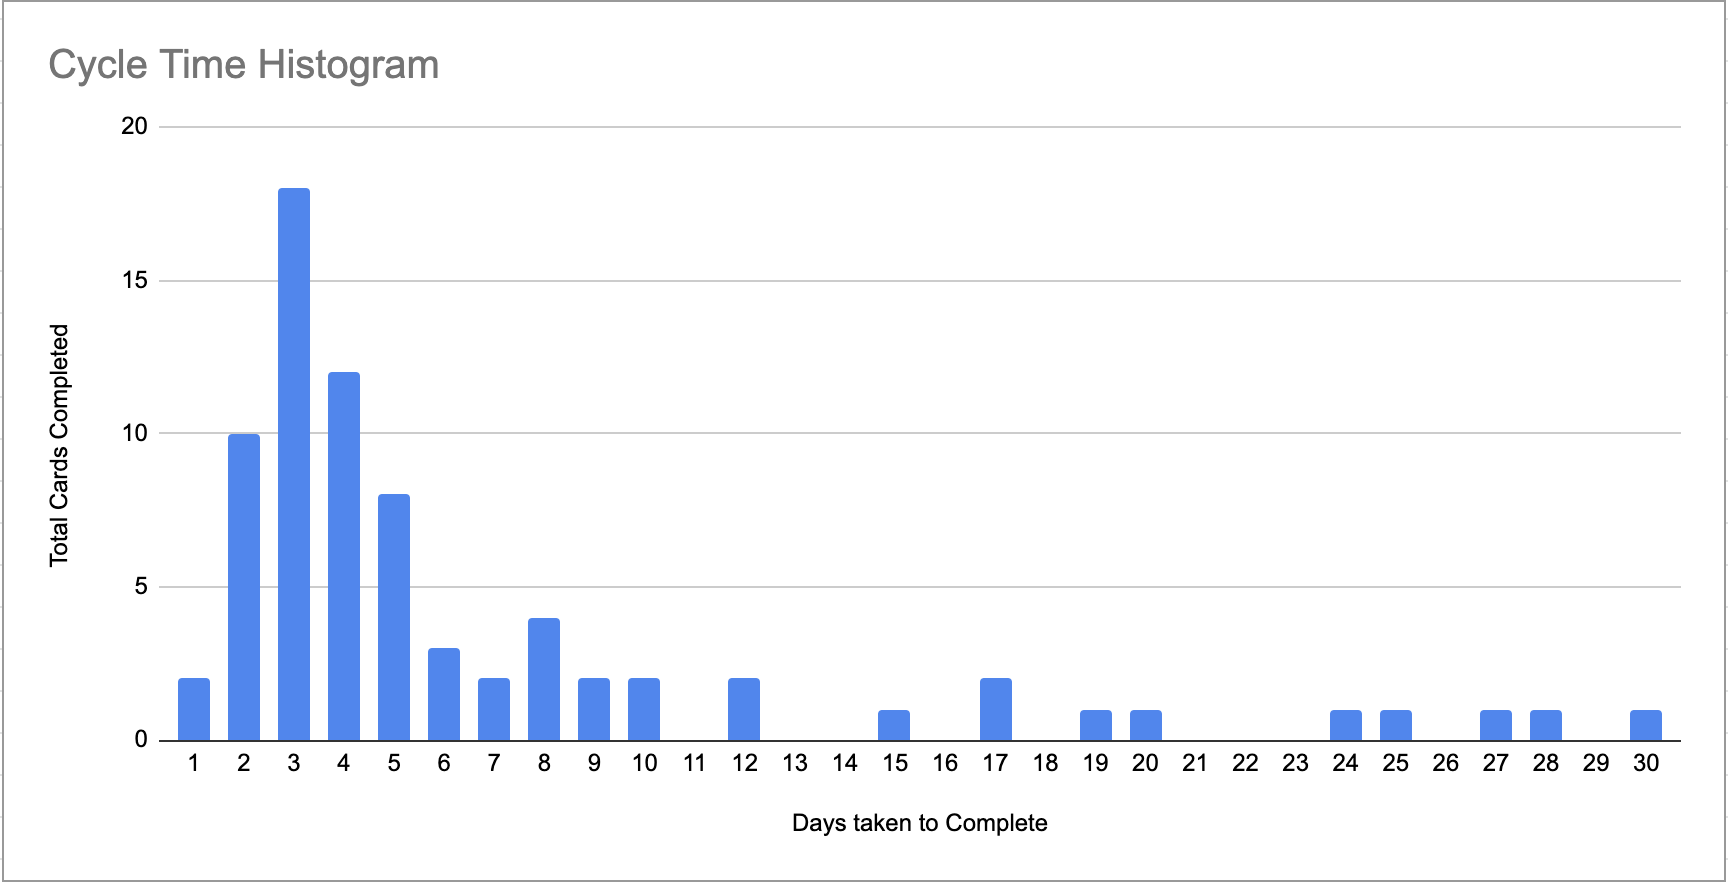
The vertical axis repreresents the number of cards delivered and the horizontal axis how long it took to deliver them so, for example:
8 cards were delivered ON day 5 and 50 cards were delivered BY day 5. Tabulating this we get:
| Day | Cards delivered ON that day | Cards delivered BY that day |
|---|---|---|
| 5 | 8 | 50 |
| 12 | 2 | 85 |
| 20 | 1 | 90 |
| 30 | 1 | 100 |
Using this data we are asked to predict when a project that’s been broken into 10 tasks and has been assigned two developers will be finished. NOTE these tasks have not been sized using velocity
Using the above data we can multiply the probablity of cards being completed by the number of cards and divide that by the number of developers.
For example: 85% of cards (85 of our 100 total) have been delivered in 12 days or less so there is an 85% chance that we can deliver 10 cards in 120 days (10 * 12) and with a team of two complete the project in 60 days (120/2).
- 50% chance the project is delivered in 25 days (5 * 10 / 2)
- 85% chance the project is delivered in 60 days (12 * 10 / 2)
- 90% chance the project is delivered in 100 days (20 * 10 / 2)
- 100% chance the project is delivered in 150 days (30 * 10 / 2)
All models are wrong
If you’re thinking this looks like a gross approximation then you’re not wrong. As the statistician George Box once wrote “All models are wrong - some are useful”. Of course this simplistic model is wrong but we would argue that it’s very useful.
Quantum physicist Niels Bohr to legendary baseball player (and philosopher) Yogi Berra states: “It is difficult to make predictions, especially about the future.”
Deliver faster
You’d be right in thinking that choosing the 90% delivery target is probably the safe bet but it’s worth noting that the 90% delivery prediction is 100 days - 4 times higher than the 50% delivery prediction.
If we use cycle times to understand what is driving the long tail of the historgram above - everything beyond, say, 10 day delivery cycles - then we may be able to significantly reduce the time taken to deliver overall projects.
What are Cycle Times not so good for ?
As the saying goes, there are lies, damn lies and statistics. If your leadership is not comfortable with probabalistic outcomes and how to use them then at best these numbers won’t mean much and at worst cause confusion and alarm.